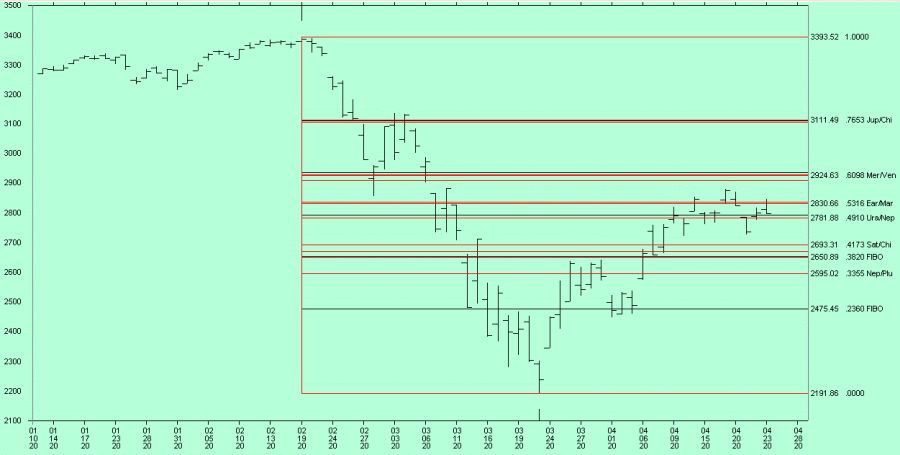
This is the Official website of the Magi Society for Financial Astrology


Charts and data below were last updated April 24, 2020


The green chart above is a Stock Graph of the SP500 Index and shows the most current Elliott Waves. The Data shown on the right margin are the AstroFibonacci Support/Resistance Levels calculated from the high and low of the SP500 prices shown in the chart. STOCK PRICES ARE MOST LIKELY TO TURN AT ASTROFIBONACCI LEVELS because they find the most support and resistance at these levels.


The gray chart above is also a Stock Graph of the SP500 showing the Current Controlling Trendlines. The data shown in the grid on the right gives you the exact SP500 price for both the Red and Blue trendlines for each date that the trendline is in play. Stock prices will find strong support or resistance at the trendlines.


AstroFibonacci Support/Resistance Levels are listed in the 3 tables below.
S&P500 Wave 1
(Jan 15, 2016 to Feb 19, 2020)
2908.20
2788.65
2788.65 - Major
2779.63
2658.50
2601.81 - Major
2601.81
2587.56
2470.86
2441.73
2414.97 - Major
2414.97
2341.34
2183.95
2183.95 - Major
2122.67
S&P500 Wave 2
(Feb 19, 2020 to Mar 23, 2020)
2835.71
2792.69 - Major
2792.69
2781.88
2693.31
2671.20
2650.89 - Major
2650.89
2595.02
2475.57
2475.57 - Major
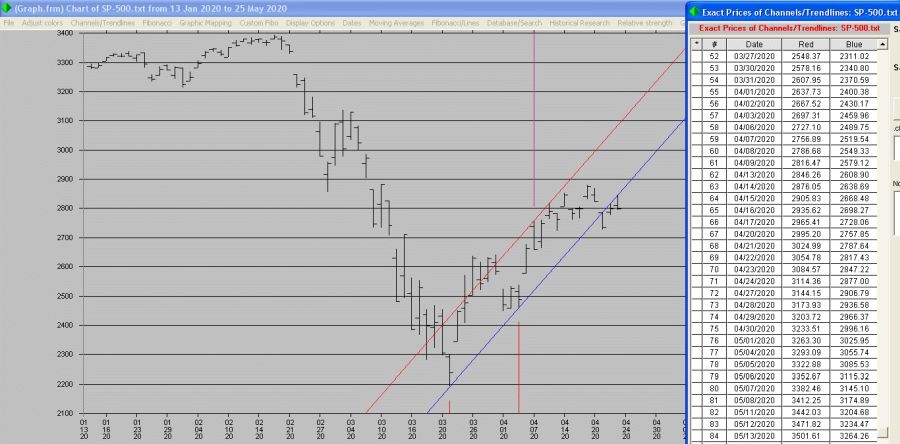
S&P500 Wave 3 - Current
(Began Mar 23, 2020)
2913.75 - major
2844.74 - major
2804.22 - major
2790.65 - major
2769.13 - major
2746.22 - major
2694.56 - major
2661.22 - major
2650.79
2638.67 - major
2632.71 - Major
2554.00 - Major
2547.48
2494.13 - Major
2480.80 - Major
2474.50
2472.69 - Major
2468.57 - Major


The three tables above show the most important AstroFibonacci support/resistance levels for the three most recent Elliott Waves of the SP500. The table at the right shows the current wave's resistance/support levels and these are the most important now. If you are a good stock trader and know how to watch these levels tick by tick, you will find that stock prices gravitate towards these levels.